Using GDB
To debug embedded Rust applications with GDB we currently recommend using tooling like OpenOCD, JLinkGDBServer or pyOCD
Although cargo-embed v0.10 (and v0.10 of probe-rs, the library that powers cargo-embed)
support spawning a GDB server it has some limitations
- stepping through the code (e.g. GDB's
stepandnextcommands) is imprecise or doesn't work in some cases - it's not possible to have a GDB server and RTT channels running at the same time so you can use GDB OR RTT but not both together (this limitation is likely to be removed in v0.11)
The rest of this section covers how to debug an embedded application within VS code using OpenOCD as the GDB server.
Dependencies
-
Make sure you've connected your Development Kit: USB port J2 on the board
-
You'll need to install OpenOCD. Installation instructions vary depending on your OS.
-
Install the cortex-debug extension in VS code.
Preparation
For the best debugging experience, the dev (development) compilation profile should be set to its
default settings.
For this tutorial, we'll be using the beginner/ applications, so let's modify beginner/apps/Cargo.toml to revert the dev profile to its default.
 panic-log = { path = "../../common/panic-log" }

 # optimize code in both profiles
-[profile.dev]
-codegen-units = 1
-debug = 1
-debug-assertions = true # !
-incremental = false
-lto = "fat"
-opt-level = 'z' # !
-overflow-checks = false

 [profile.release]
How to
-
In VS code, from the top menu pick "File" > "Open folder". Then open the
beginner/appsfolder. -
Within this folder, open the
src/bin/hello.rsfile. -
From the top menu, pick "Run" > "Start Debugging".
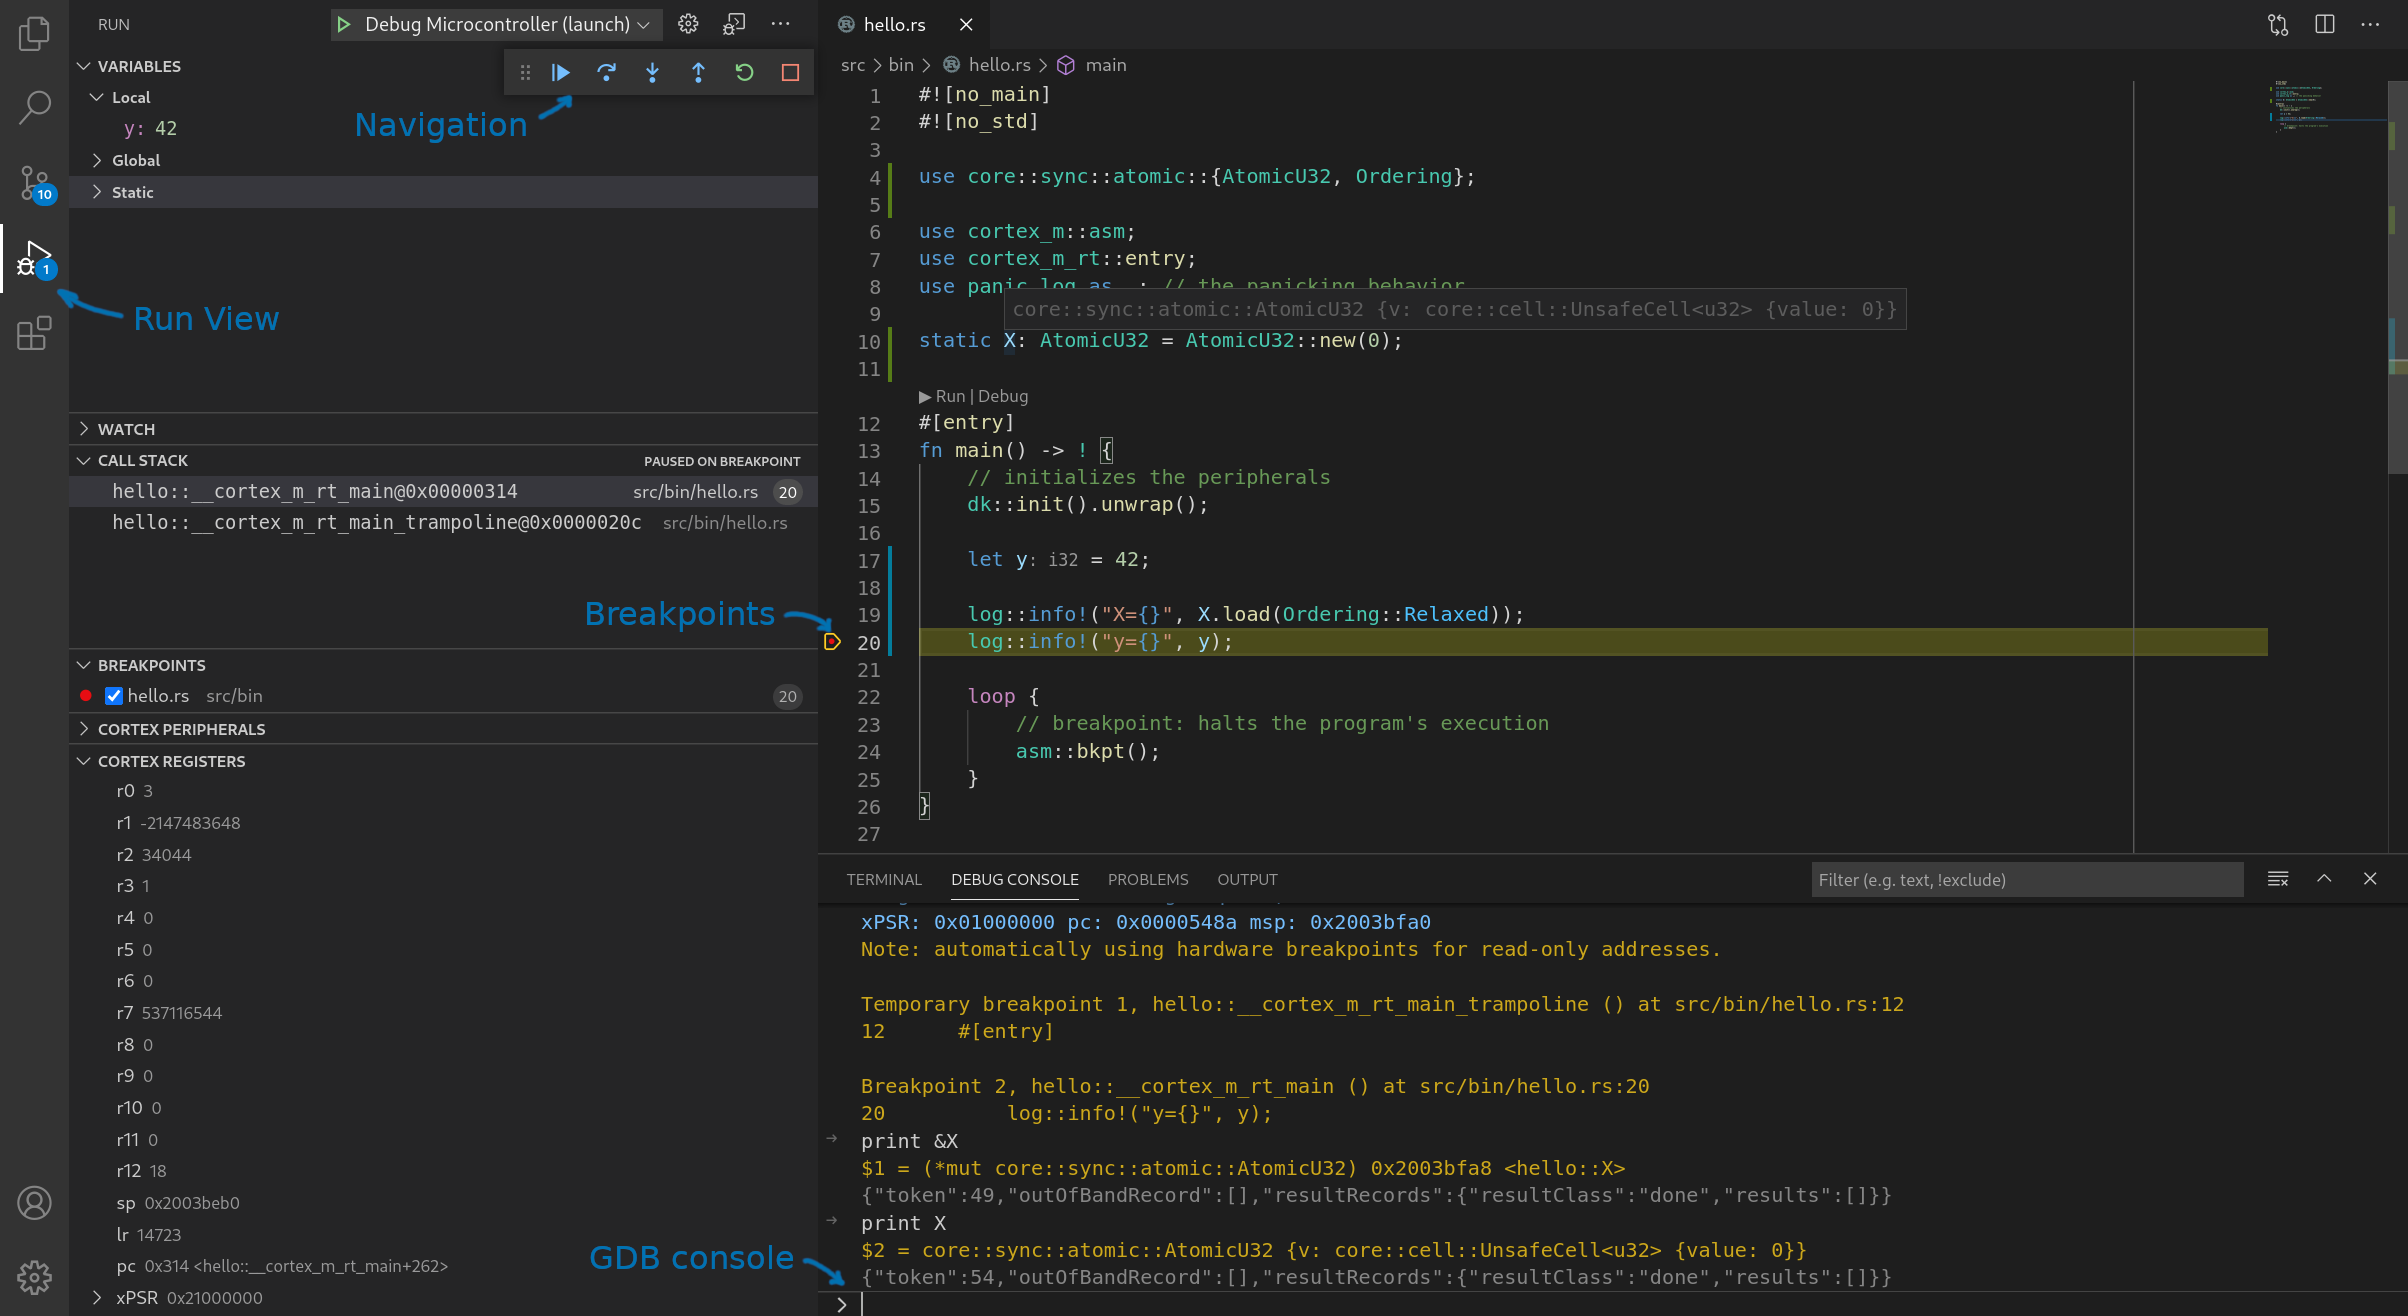
You are now in a GDB session. Switch to the "Run" view (4th icon from the top on the left sidebar), if VS code didn't automatically switch to it, and you'll see debug information like the call stack, local variables, breakpoints and CPU registers on the left side. On the bottom panel, you can switch to the "Debug console" to issue commands to the GDB server. Near the top of the GUI you'll find a row of buttons to navigate through the program (step, continue, etc.). Breakpoints can be added by clicking to the left of line numbers in the file view.
Debugging a different program
To debug a different program within the beginner/apps folder you'll need to modify the
beginner/apps/.vscode/launch.json file as follows:
 {
     "version": "0.2.0",
     "configurations": [
       {
         "cwd": "${workspaceRoot}",
-        // TODO to debug a different program the app name ("hello") needs to be changed
-        "executable": "./target/thumbv7em-none-eabihf/debug/hello",
+        "executable": "./target/thumbv7em-none-eabihf/debug/blinky",
         "name": "Debug Microcontroller (launch)",
Change the name of the program from hello to whichever program you wish to debug.